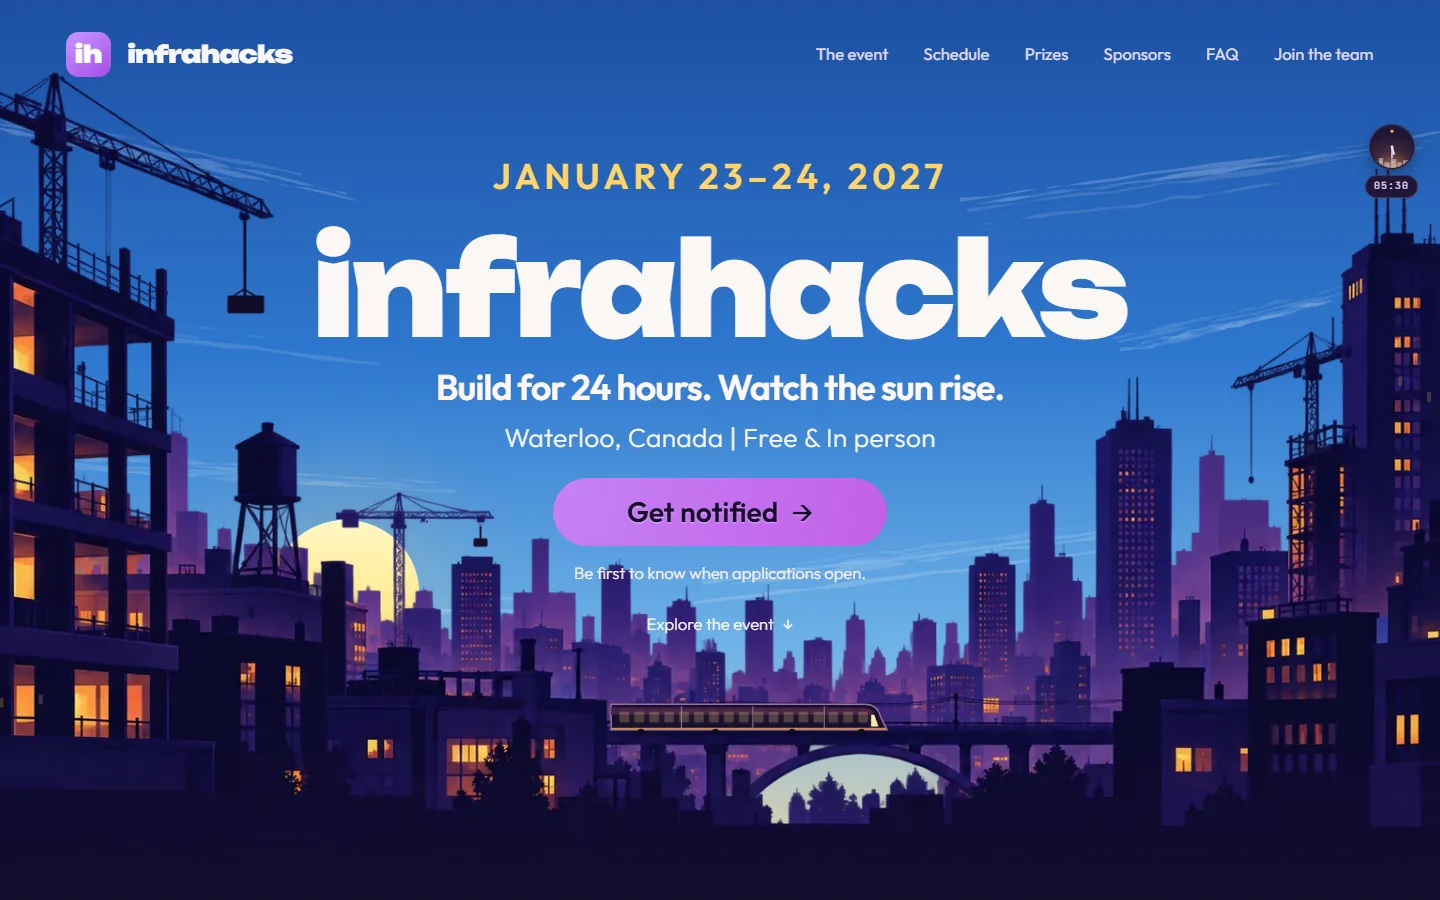
One repo runs the whole hackathon: the public site, applications, and the tools organizers and hackers use on the day.
My work. I built it: a Vercel serverless API on Postgres, an application pipeline with review and decision emails, judging with per-judge score normalization, QR ticket check-in, a mentor help queue, and live announcements mirrored to Discord.
InfraHacks is a 24-hour hackathon for the built world (housing, transit, energy, water) in Waterloo, January 2027.
Judges score each project on four criteria. Because judges differ in harshness, the leaderboard turns each judge’s totals into z-scores before averaging, so a team isn’t punished for drawing a tough judge; the normalization has unit tests.
There are no client-side secrets: keys live in Vercel environment variables and are read only by the API. Organizer endpoints compare passwords in constant time and rate-limit failed attempts, and email unsubscribe links are HMAC-signed.
A resting buy limit fills on its own · simulated prices
PaperTrader
Personal project
How does a backend handle two orders that try to spend the same balance?
Result Two orders racing for the same balance can’t both fill, and a fill can’t beat a cancel that committed first. Tests run these races against real Postgres.
A paper-trading simulator: a React terminal, a Spring Boot execution engine, and PostgreSQL. Limit orders rest in an order book and fill on their own when the price crosses them.
Resting limits sit in an in-memory order book per symbol: sorted price levels, oldest first within a price. The book only suggests fills. Each one locks the account row and re-checks the order, so Postgres decides. Cash, position, order status, and the trade commit together; idempotency keys stop duplicate orders, and portfolio updates use WebSockets.
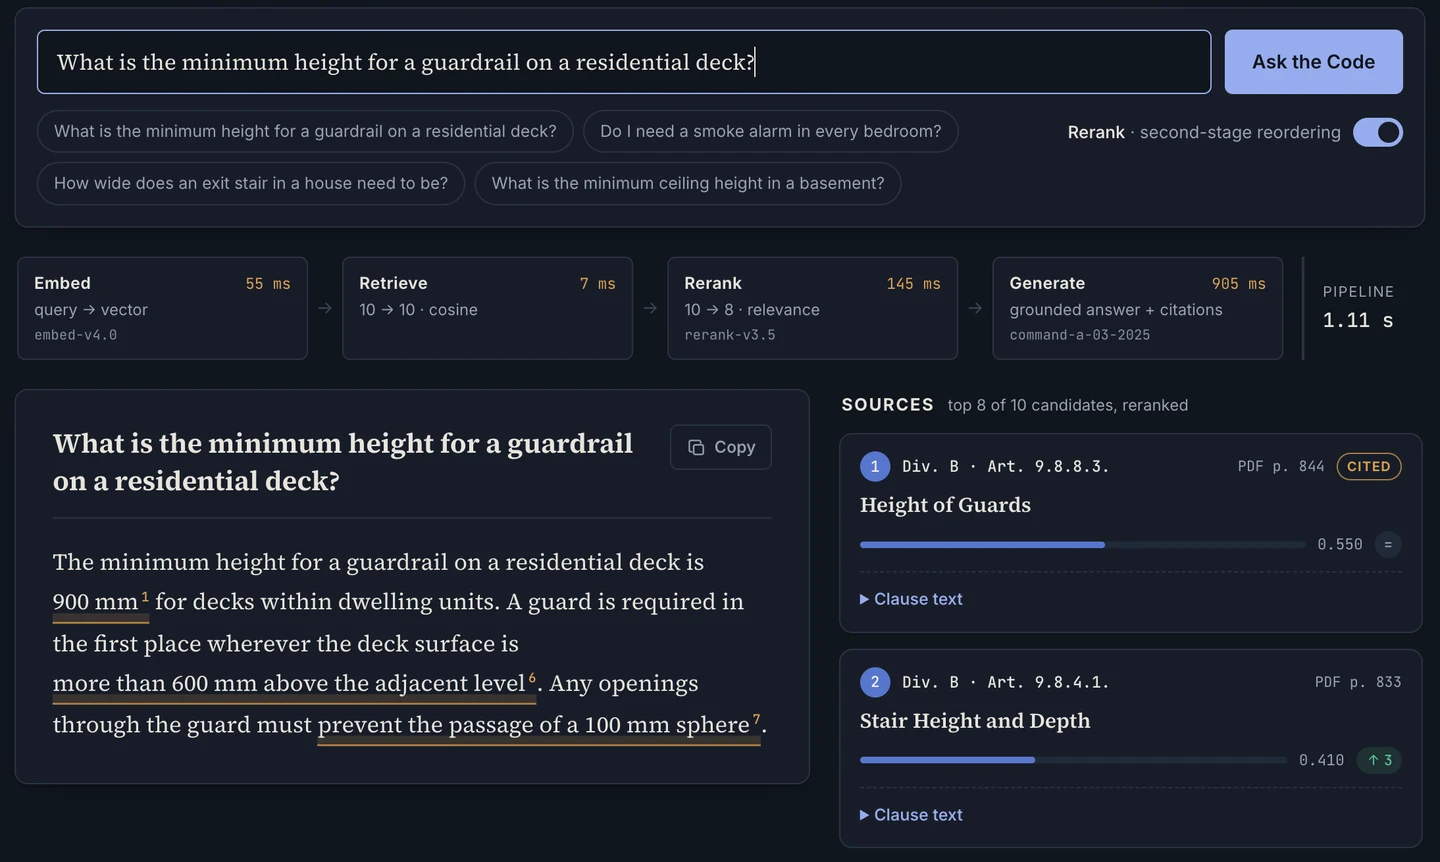
Answer with source clauses · demo screenshot
CodeCite
Personal project
I wanted to check building-code answers against the clauses they came from.
Result The expected clause was in the top three results for 27 of 30 test questions (90%).
Ask a question about the National Building Code of Canada 2020 and see the clauses used in the answer.
The parser keeps each clause’s number and text together. Reordering the results with a second model did not improve the top-three score.
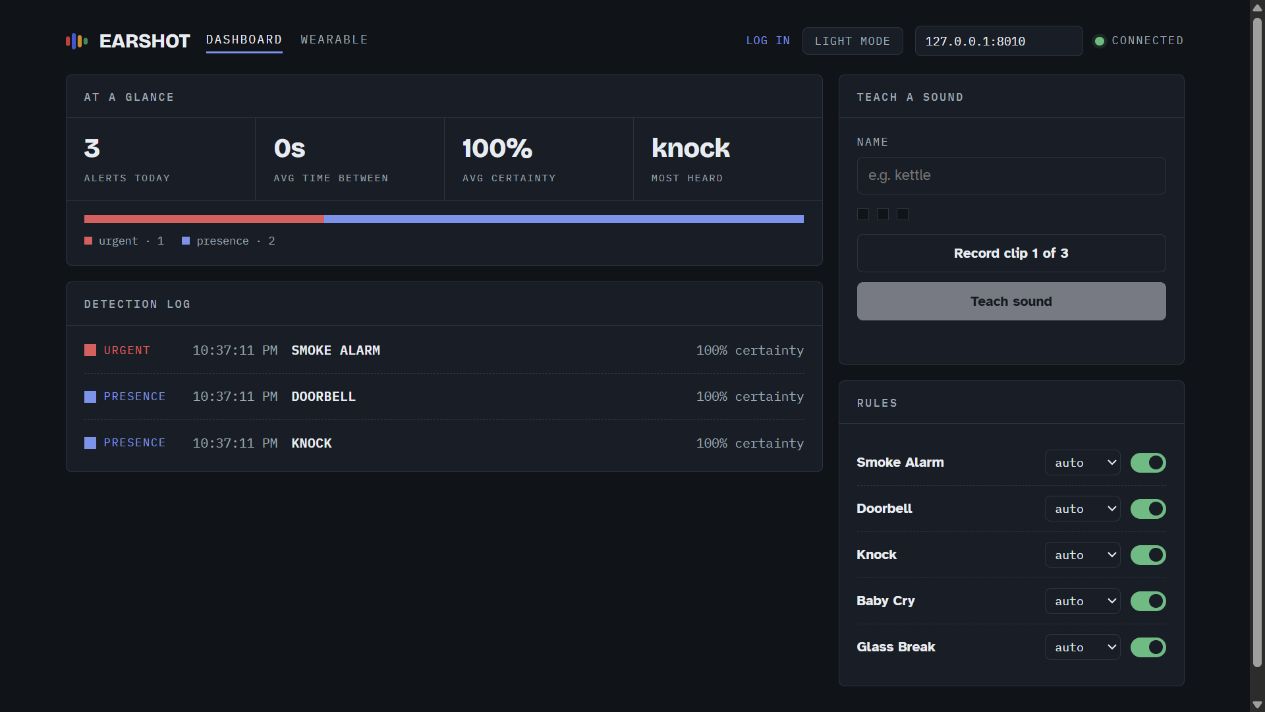
Dashboard · local demo with simulated sound events
Earshot
Hack the 6ix 2026
We wanted to help Deaf and hard-of-hearing people notice everyday sounds through light and vibration.
My work. I integrated the Raspberry Pi, added a polling fallback for network restrictions, designed the wearable in CAD, and worked on the setup documentation.
A prototype that detects sounds such as knocks and doorbells, then sends alerts to a Raspberry Pi wearable. It also has a live dashboard and can learn custom sounds.
For the demo, a laptop recorded and classified sounds and ran the backend. The Raspberry Pi controlled the wearable’s RGB LED, vibration motor, and buzzer. The dashboard received events over WebSockets.
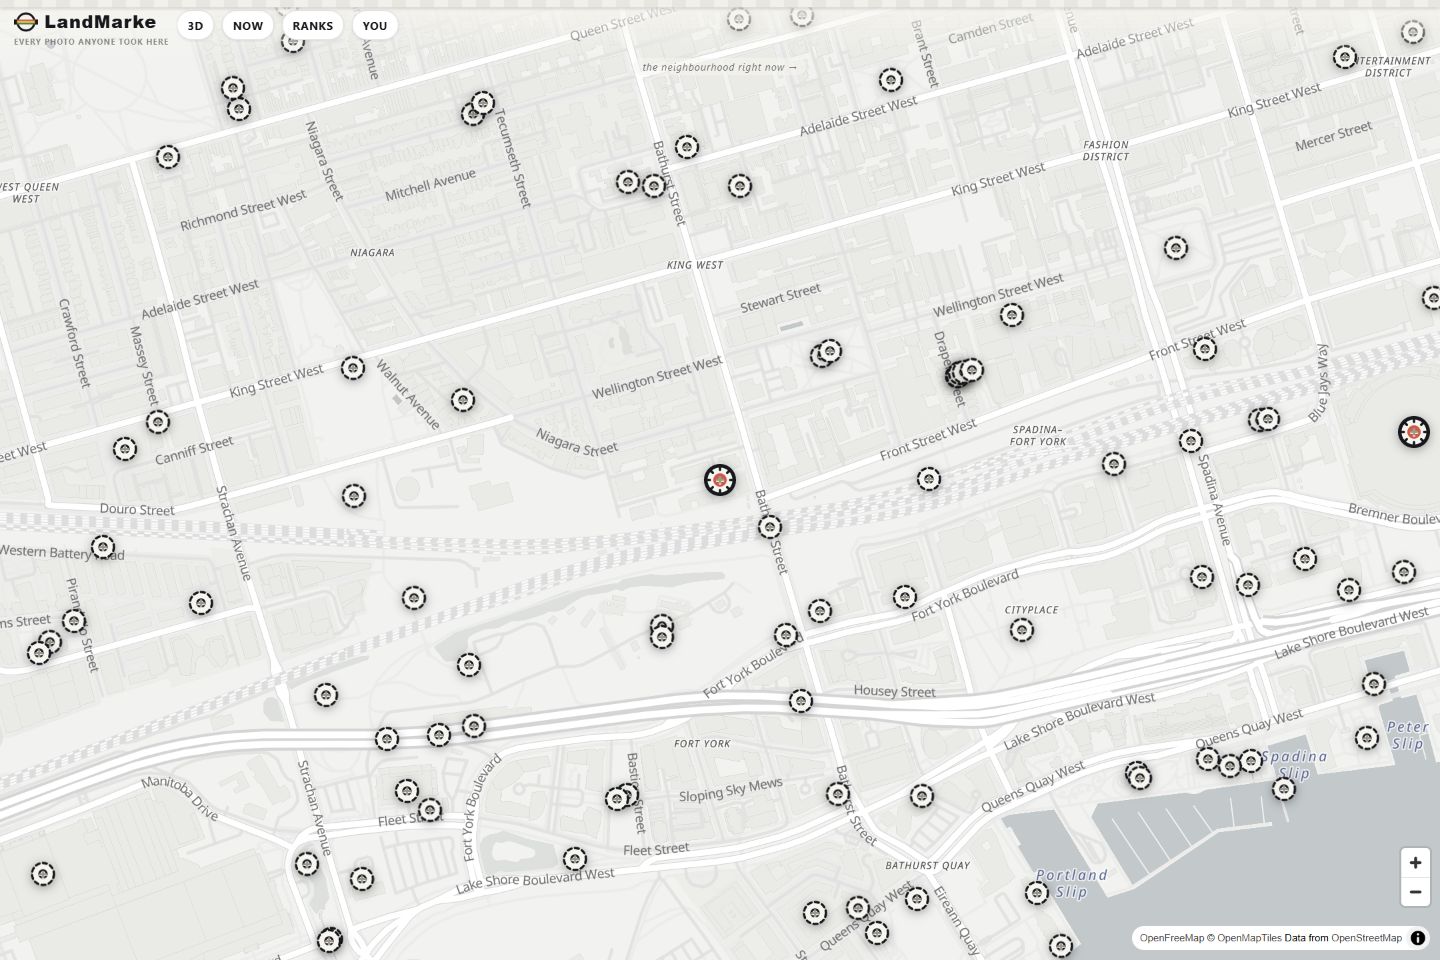
Players visit landmarks and claim them with a photo. The photos form a permanent archive and update a dashboard of neighbourhood activity.
The dashboard analyses photo colour, brightness, saturation, and sky coverage. It updates over WebSockets, and MapLibre displays the map. Built with Ibrahim Qureshi and Joshua Zhang.
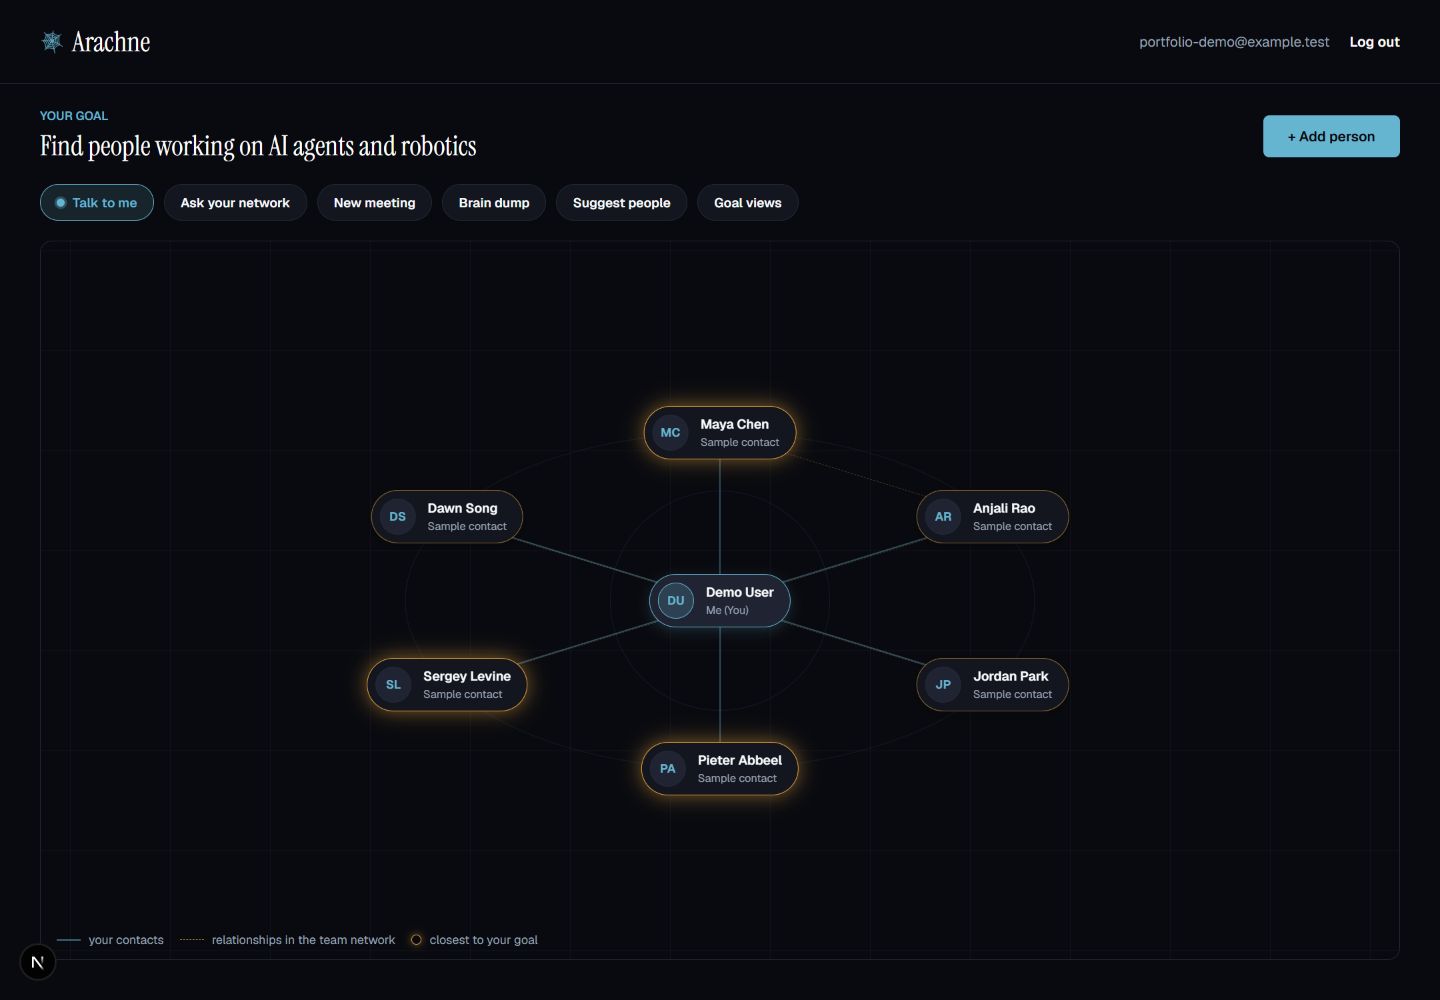
Main app · local demo with sample contacts
Arachne / YourWeb
HackMIT 2026
Tell YourWeb what you’re trying to do. It helps you find people to contact.
My work. I added saved profiles, research based on resumes, and persistent follow-ups. I also fixed issues when switching between people.
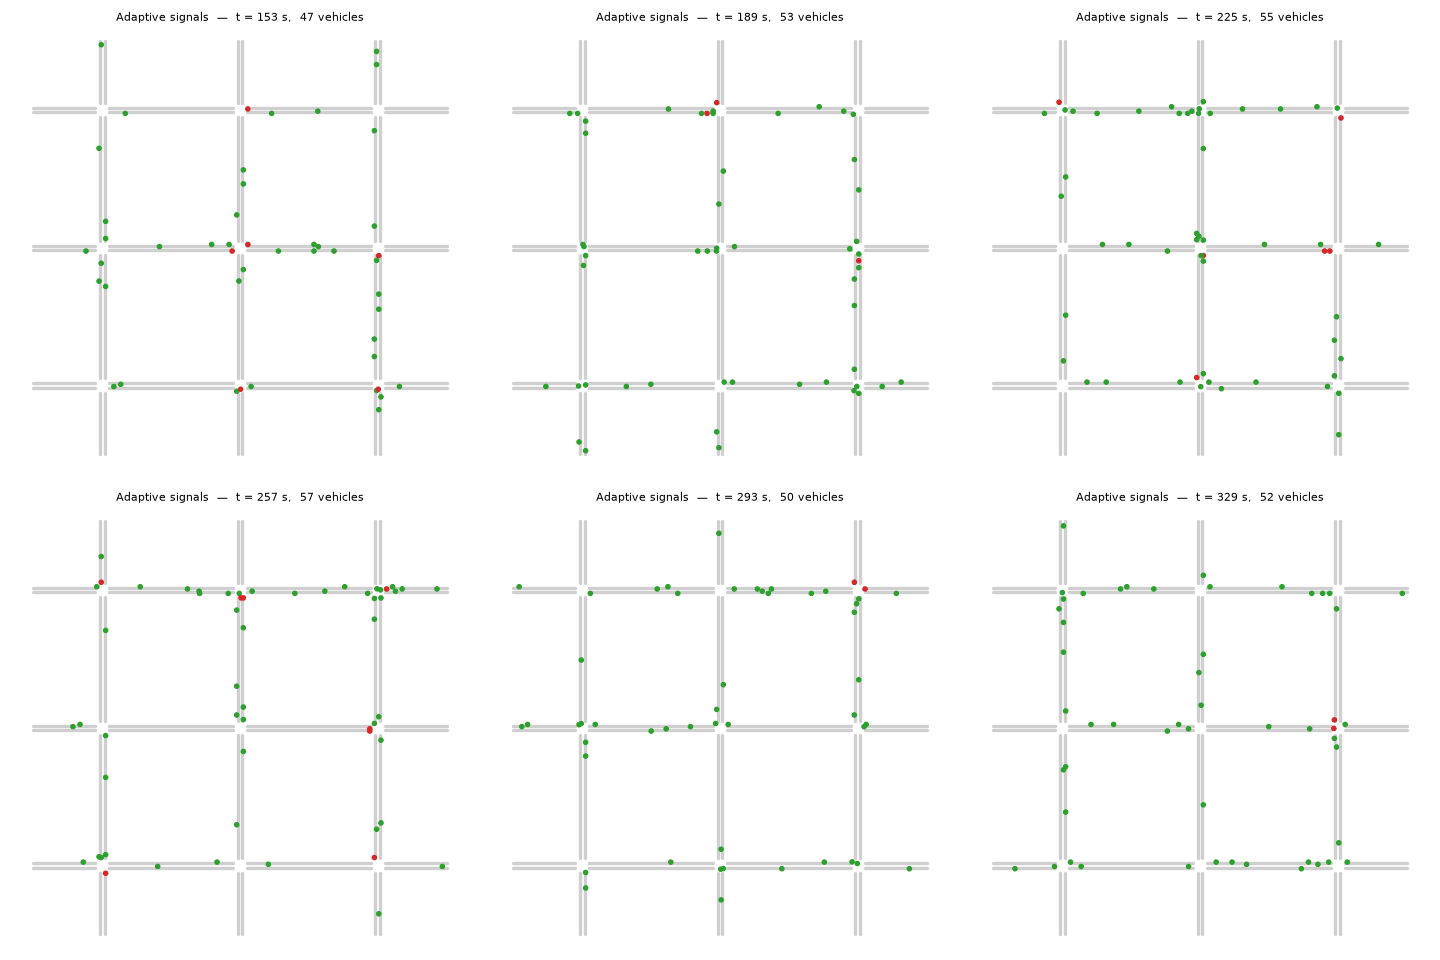
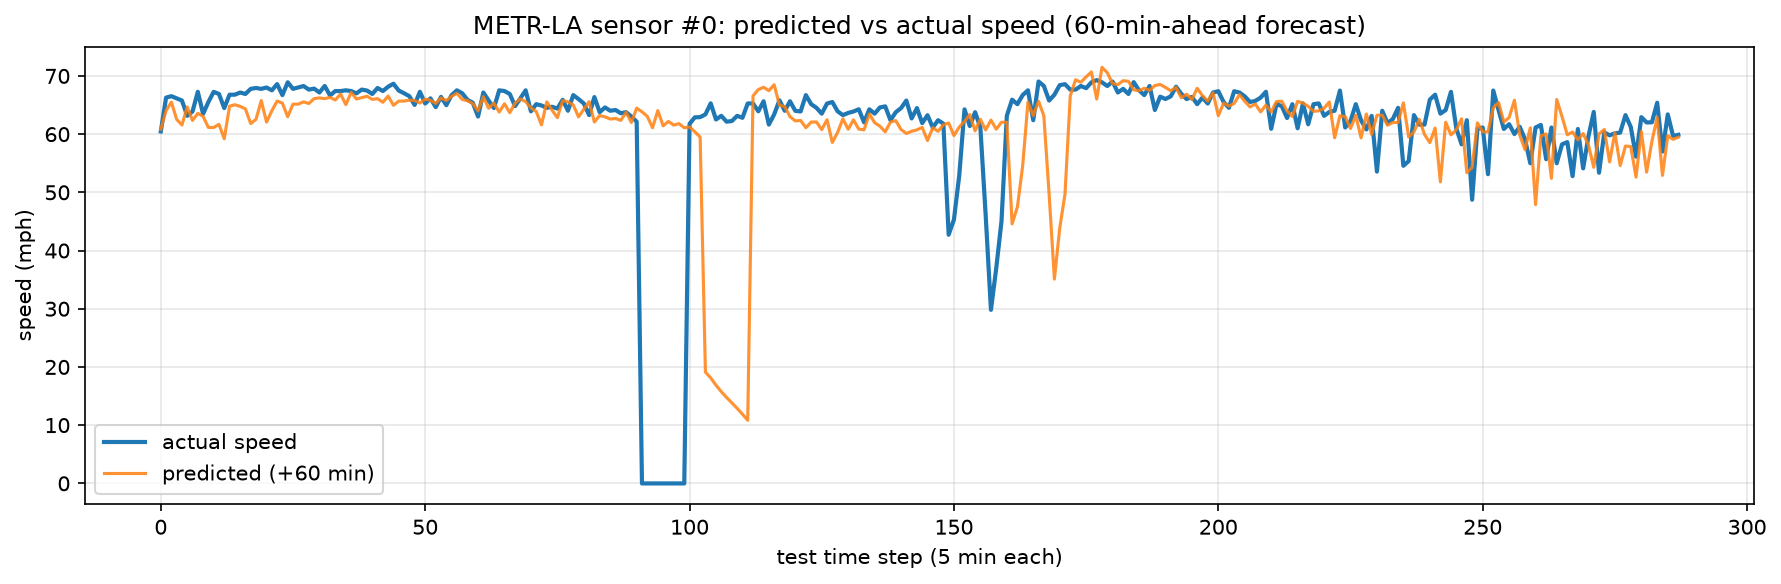
A graph neural network forecasts highway speeds 60 minutes ahead using data from 207 Los Angeles sensors. A separate SUMO experiment tests traffic lights that respond to vehicle queues.
The baseline assumes speeds stay at their latest reading. The model’s mean absolute error was worse than that baseline: 5.91 versus 5.45 mph.
Connecting the traffic forecast to the signal controller remains future work. Some zero-speed readings in the plot represent missing sensor data.